
Haley Gyorda
Marketing Strategist & Content Creator
WhO Am I?

My name is haley! i'm 22 years old and recently earned a B.a. in advertising/marketing. I'm certified in social media marketing, and have about three years of content creation experience under my belt. i develop content around lifestyle, fashion, beauty, and health/wellness, and am looking to expand into business/career development.
I currently work in corporate marketing, and outside of work, I Am a dancer/choreographer, avid coffee drinker, pinterest pinner, and believer in retail therapy.
click for resume
What can UGC do?
Facts & Statistics
Source: Embed social
75% of marketers claim that UGC makes a brand more authentic
consumers spend four to five hours/day with ugc content
31% of consumers say authentic ugc content is more memorable
ugc provides social proof and instills trust

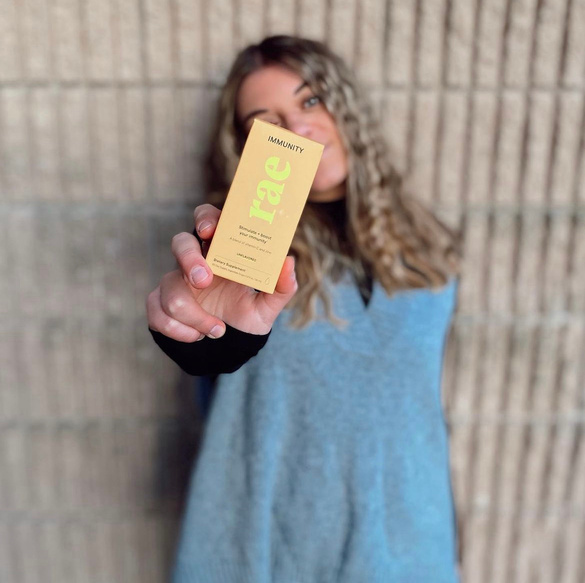
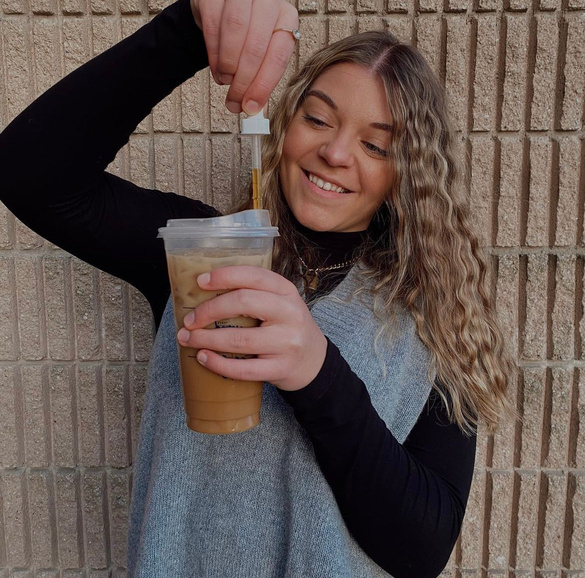
Video Content
Product usage
Voiceover
Trending sounds
organic unboxing
Static Content
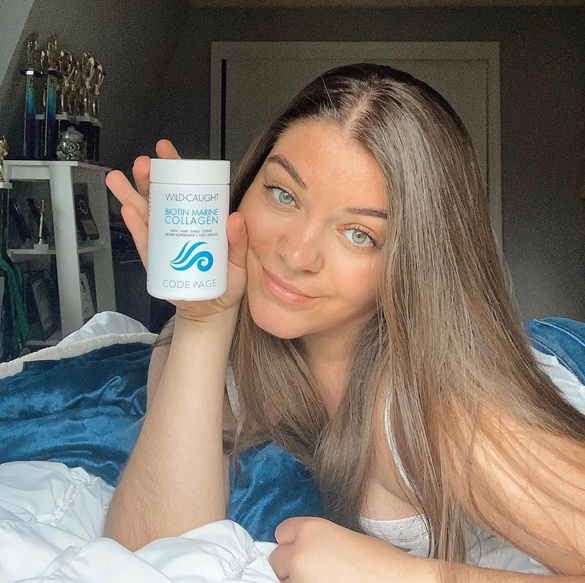

Past Brand Partnerships


Reach out!
Let's create.
haleygyorda@icloud.com
+1 (603) 552-0702
Sample Campaign Plan
Completed for senior capstone (STc485)
Quinnipiac university, spring 2022

MAHV Agency
META QUEST 2 CAMPAIGN

September 2022 - February 2023
Campaign Scope

Budget: $50 million

Campaign Timeline: 6-month campaign, September 2022 – February 2023

Campaign Objectives: Increase brand awareness and recognition, and drive purchases in the US market
Company Overview
The "quest" (VR Headset) was officially unveiled on September 16, 2020 during Facebook Connect 7.
Social Media

1.8 Million likes
536K followers

491.5K followers
2

MAHV Agency

Meet the Team
Haley

MAHV Agency, has a professional and trusted team to provide all advertising solutions for your company.
Vanessa

Amanda

Meghan

1
Market Analysis
In 2020, the virtual reality market size was valued at $15.81 billion and is expected to grow at a compound annual growth rate of 18% from the years 2021 to 2028 [1]. The global impact of COVID-19 has negatively impacted the virtual reality devices across all regions [2].
Competitive Analysis
Meta Quest’s VR Headset is said to be “the most affordable and most convenient” VR Headset, since its release in October 2020. Meta Quest is a company that has several VR products, and their number one competitor is Steam. Meta’s CEO is Mark Zuckerberg, one of the most successful men in the technology industry, if this doesn’t say enough about Meta’s products, its numbers in market share should speak for itself. The Meta Quest VR Headset is sitting at about 46% of the market share. All VR Headsets, like Meta’s, have had a 348% shift in global shipments since 2020, but Meta products,
including this VR set, make up ¾ of that market share [3].
Now, analyzing this competitor analysis, as this is Meta’s greatest competitor,
obviously Steam’s Valves Index VR Kit comes with about double of the
amount of “accessories” than Meta’s VR Headset. Looking into the items
Steam’s headset comes with, it seems like half of these items are
unnecessary to most of its users. Meta’s VR Headset comes with everything
necessary, nothing extra, and nothing missing, for an astonishing retail price,
never seen before in VR headset products.

Another VR Headset in the market is PlayStation. Their new product, “PlayStation VR Marvel’s Iron Man Bundle” is targeting a very specific audience of Marvel lovers. This headset falls in a closer price range to Meta, but again, targets a
very specific audience, and will lose consumer value. This product also comes with tons of extensions and extra accessories, not required by Meta and its VR Headset products.
Compared to Meta’s VR Headset, the competitors products and prices are
extraneous. Vive products are targeted towards gamers, the PlayStation
products are targeted to gamers and specifically Marvel fans. The Meta Quest VR
Headset targets an age range of 21-31 years old and reaches industries such as
real estate, Metaverse, architecture, and engineers. The Meta’s wide variety of
usage limited necessary accessories, and prices outshine its competitors,
explaining why it dominates the market of VR headsets.
To look at a general competitor analysis between Meta Quest VR Headset,
and their primary competitors: Steam’s Valve Index VR Kit, PlayStation's "VR
Marvel’s Iron Man Bundle,” and Vive the chart outlines the cost of the
products to see which stands out the most [4].
3
Target Market
Primary: Dedicated Gamers

The primary target we are marketing towards are Dedicated Gamers. As of now, Dedicated Gamers currently spend 2.4 hours per week with VR. The age range our agency is focusing on is between 13-20 and are mostly male. They, or their parents, spend two times more on games, devices, accessories, and in- game purchases. Dedicated Gamers spend around $200 per year on video games. Gamers who are passionate about their game are more likely to upgrade to new hardware and content. Developers should focus on delivering top-of-the-line VR content in order to attract this audience. Although
Dedicated Gamers spend most of their time playing solo games, they play multiplayer games as well; Dedicated Gamers like socializing while playing games, but their main motivations are to take on new tasks and attain new goals. The top games played by the dedicated gamer, at 75%, are first person shooters. Even though Dedicated Gamers widely enjoy activities outside of VR, they are early adopters and are highly knowledgeable about VR hardware and games. They are also likely to be Core PC gamers.
Dedicated Gamers are serious tech fans. They are interested in
learning about unique products and want to know as much information
as possible about the ones they purchase. They are likely to encounter VR hardware and content on gaming sites, blogs, and forums. They respond extremely well to experienced recommendations. Dedicated Gamers are impulsive. They are the ideal audience for taking the plunge and purchasing new products since they crave the latest and best technology [5].
Dedicated Gamers are also competitive and boastful. Virtual reality and its gaming experiences keep passionate gamers where they want to be: on the forefront. This appeals to their competitive drive as well as their desire to learn new things.
Secondary: Architects/Engineers

Operating in numerous locations, the architects and engineers have numerous responsibilities that can be improved with the efficacy of VR. The architects and engineers have the responsibilities of designing the building with attention to Title 24 compliant. Engineers need to calculate the necessary electric power loads for the entire building amongst other systems. Their personal goals include pleasing their clients, winning awards, and getting published. But for the project itself their goals are to be involved in every stage of the project and keeping within budget and code requirements. The challenge of this industry includes finding reliable and knowledgeable partners during the planning process to specify materials, fixtures, appliances, etc. The challenges they face with Meta Quest is the unfamiliarity with our systems and technology, therefore, they have a tendency to work with or prefer established relationships. Professional recommendations by previous clients and associations they belong to would more likely draw them to the product. With our equipment we can help with specifications and engineering requirements by reviewing blueprints, schemes, and dimensions all through the headset. In addition to other relevant needs, our involvement covers the entire project from conception to completion.
4

Research Insights for Target Market
Ever since the height of the COVID-19 pandemic, the diversity of demographics in the Dedicated Gamer target market has expanded. In the United States, females have come to represent about 45% of gamers, with males still leading the pack. Within this market, these players or their parents make a lot of purchases, especially through in-game experience. Gamers at this age are immersed in all new types of technology, so they are more apt to be playing and purchasing through hand-held devices or gaming consoles compared to PC’s, according to a 2018 survey on U.S. teens ages 13-17 [6]. By 2021, mobile gaming actually accounted for more than 50% of the gaming market. Dedicated Gamers are a group to recognize for this exponential growth [7]. About 20% of gamers in the U.S. are under 18, which is a small but mighty statistic [8]. Most parents of gamers in this age category (70%) approve of their kids utilizing their time immersing themselves in these digital experiences, and sometimes are even joining them to play. Most often, young gamers have reported that they enjoy spending time with family or friends by playing video games together. 29% of these gamers own or use VR headsets, which provide absolutely immersive experiences for users [7].
As a teen/young adult, you are still developing and learning more about yourself through life experiences. Education is a genre of video games for young gamers looking to challenge their brains and have fun. About 59% of parents say that their kids use educational games, with 63% saying that it had a positive effect. According
to the Entertainment Software Association, or ESA, 89% of U.S. users say that gaming can create accessible experiences for people with disabilities. Overall, Video games can help to provide users joy, mental stimulation, inspiration, relieves stress, and teamwork/collaborative skills [9].
The work that is planned and executed by professionals in the architectural industry is very design-oriented. With that, they are also extremely detail-oriented, as
they are required to comply with many rules and regulations in buildings. Virtual reality is able to show them the entire world in 3-D, giving them a clear view of their designs and important structural details. Alongside their contribution to projects, collaboration with other services is a large part of the process. Architects are more apt to collaborate effectively with other architects and engineers if all participants are on the same page. VR allows these teams to view their designs at the same time and actively communicate [10]. According to The American Institute of Architects, only about 16% of current firms are actively using VR in their practices [11]. The future of architecture and engineering is on the rise, and it is bound to reshape these professions.

5
Creative Mock-ups
6
Creative Mock-ups
7
FLIGHT 1: BRAND AWARENESS
Organic Content on Branded Accounts
Media Type: Social Media
Cost: $0
Total Impressions: 7,320,000 impressions
Instagram Promoted Posts
Media Type: Social Media
Cost: CPM $7, 54 posts, totaling $113,400
Total Impressions: 300,000/post (54 posts)= 16,200,000 impressions
Facebook Promoted Posts
Media Type: Social Media
Cost: CPM $9, 54 posts, totaling $243,000
Total Impressions: 50,000 impressions (24 times)= 1,200,000 impressions
YouTube Video Ad :30 spot
Media Type: Social Media
Cost: CPM $7.50, totaling $4,500
Total Impressions: (6 times)= 100,000 impressions
Snapchat Sponsored Lens
Media Type: Social Media
Cost: $9,000,000
Total Impressions: 50,000,000 impressions/day (23 days) = 1,000,000,000 impressions
AIA Conference on Architecture Booth
Interns
Media Type: People Power
Cost: SXSW: (3 interns): 2 interns working 10 hours a day for 30 hours ($300 x 2) = $600 1 intern for 19 hours = $190 ($790 total)
AIA: 2 interns working 10 hours/day for 30 hours ($300 x 2) = $600 Twitch event: (2 interns) One intern for 15 hours = $150, One for 19 hours = $190 ($340 total)
Billboard
Media Type: Out of Home
Cost: $6,000 for 2 months = $12,000
Total Impressions: 1,500,000/month = 3,000,000
Kiosk Board
Media Type: Out of Home
Cost: $2,000 for 1 month
Total Impressions: 800,000 impressions
Digital Billboard
Media Type: Out of Home
Cost: $4,000
Total Impressions: 2,500,000 impressions
Bus Wrap Exterior
Media Type: Out of Home
Cost: $350/ad (10 ads), for 2 months = $7,000 Total Impressions: 160,000 impressions
Media Type: Event (Chicago; September)
Cost: $43.50/per square ft (50x20 space); 3-day event= $130,500 Total Impressions: 20,000 impressions
Gaming Event: Partnering with Twitch Streaming
Media Type: Event (Seattle; December) Cost: $7,000/day (3 days) = $21,000 Total Impressions: 100,000 impressions
SXSW Tech Event Booth
Celebrity Partnership: Michael Jordan
Media Type: Collaboration (Appearance at SXSW Event in January) Cost: $3,000,000 (one day)
Total Impressions: 100,000 impressions
Celebrity Influencer: PewDiePie
Media Type: Collaboration (Posting to promote Meta throughout the campaign/making an appearance at the Twitch event in Seattle)
Cost: $300,000 (17 times) = $5,100,000
Total Impressions: 1,000,000 (17 times) = 17,000,000 impressions
Media Type: Event (Houston; January) Cost: $81,000 for booth spot for 3 days Total Impressions: 400,000 impressions
Podcast Ad: 45 spot – Accidental Tech Podcast
Media Type: Broadcast
Cost: CPM $18, totaling $8,100
Total Impressions: 75,000 impressions (6 times) = 450,000 impressions
Streaming Service: Super Bowl Ad :30 second spot
Media Type: Broadcast
Cost: $7,000,000 x 2 = $14,000,000
Total Impressions: 416,000,000 impressions
T-Shirts
Media Type: Merchandise
Cost: $25,000
Total Impressions: 5,000 impressions
Stickers
Media Type: Merchandise
Cost: $1,000
Total Impressions: 5,000 impressions
Koozies
Media Type: Merchandise
Cost: $4,000
Total Impressions: 5,000 impressions
TOTAL FLIGHT 1 IMPRESSIONS: 1,491,165,000
TOTAL FLIGHT 1 COST: $31,757,630
8
FLIGHT 2: PURCHASE INCREASE
In-App Ads
Media Type: Digital
Cost: $15,000/month (6 months), totaling $90,000 Total Impressions: 1,500,000 impressions
Website Banner (Google Adsense)
Media Type: Digital
Cost: CPM $2, totaling $1,200
Total Impressions: 100,000 impressions each (6 times)= 600,000 impressions
Sponsored Blog Post
Media Type: Digital
Cost: $500, once a week, totaling $12,000 Total Impressions: 50,000 impressions (24 times)= 1,200,000 impressions
The New York Times, regional newspaper
Media Type: Print
Cost: CPM $14, totaling $291,200
Total Impressions: 800,000 impressions (26 times) = 20,800,000 impressions
The New York Times, regional newspaper
Media Type: Print
Cost: CPM $50, totaling $198,000
Total Impressions: 660,000 impressions (once a month)= 3,960,000 impressions
Organic Blog Post
Media Type: Email Marketing
Cost: $0
Total Impressions: 50,000 impressions
Email Newsletter (Promo Code Included)
Media Type: Email Marketing
Cost: $27,000 annual fee from Adobe Market (Meta’s internal email server)
Total Impressions: 20,000 impressions (60 times)= 1,200,000 impressions
Magazine Ad: Landscape Architecture Magazine
Media Type: Print
Cost: CPM $50, totaling $36,000
Total Impressions: 60,000 impressions (6 times)= 120,000 impressions
Product Highlight
Media Type: Email Marketing
Cost: $0
Total Impressions: 20,000 impressions
TOTAL FLIGHT 2 IMPRESSIONS: 29,450,000
TOTAL FLIGHT 2 COST: $655,400
9
FLIGHT 3: INCREASE CUSTOMER RETENTION
Bus Wrap Exterior
Media Type: Transportation
Cost: $350 per ad (10 ads @ $3500), for 6 months, totaling $21,000
Total Impressions: 80,000 impressions per ad (6 months)= 4,800,000 impressions
Bus Wrap Interior
Media Type: Transportation
Cost: $175 per ad (10 ads @ $1,750), for 6 months, totaling $10,500
Total Impressions: 10,000 impressions per ad (6 months)= 600,000 impressions
Public Bench
Media Type: Transportation
Cost: $100 per ad (10 ads @ $1,000), for 6 months, totaling $6,000
Total Impressions: 200 impressions per ad (6 months)= 12,000 impressions
Bus Stop Takeover
Media Type: Transportation
Cost: $4,000 per ad (6 ads @ $24,000), for 6 months, totaling $144,000
Total Impressions: 18,000 impressions per ad (6 months) months= 648,000 impressions
Google Adwords
Media Type: Digital
Cost: CPM $115 (16 words), totaling $460,000 Total Impressions: 250,000 impressions (16 words)= 4,000,000 impressions
LinkedIn Promoted Posts
Media Type: Digital
Cost: CPM $6.50 (36 posts), totaling $129,870
Total Impressions: Impressions: 555,000/post
(36 posts) = 19,980,000 impressions
In-App Ads
Media Type: Digital
Cost: $15,000/month (6 times), totaling $90,000 Total Impressions: 250,000 impressions (6 times)= 1,500,000 impressions
TikTok Challenge/Ad
Media Type: Social Media
Cost: CPM $10, totaling $600,000
Total Impressions: 10,000,000 impressions (one ad a month) = 60,000,000 impressions
Celebrity Influencer – Markiplier
Media Type: Social Media
Cost: $200,000 (12 posts) = $2,400,000
Total Impressions: 1,000,000 impressions per post (12) = 12,000,000 impressions
Snapchat Sponsored Holiday Lens
Media Type: Social Media
Cost: $700,000 each, totaling $11,200,000
Total Impressions: 50,000,000 impressions/day (16 times) = 800,000,000 impressions
TOTAL FLIGHT 3 IMPRESSIONS: 903,540,000
TOTAL FLIGHT 3 COST: $15,061,370
10
Overall Budget Breakdown
Digital Media: $38,383,070 (76.8%)
Traditional Media: 757,700 (1.5%)
Other (Collaborations, Events, People Power, & Contingency Fund): 10,859,230 (21.7%) Total Budget: $50,000,000
11
Budget Breakdown
%
Digital Media Spend:
Snapchat LensYouTube Video Ad :30 spot $20,200,000$4,500
Streaming Service AdIn-App Ads $14,000,000$180,000
Facebook Promoted PostsWebsite Banner (Google $243,000Adsense)
Instagram Promoted Posts$1,200
$113,400Sponsored Blog Post
$12,000
Traditional Media Spend:
Billboard
$12,000
Kiosk Board
$2,000
Digital Billboard $4,000
Bus Wrap Exterior $28,000
Merchandise
$30,000
Magazine Ad
$36,000
Regional Newspaper Ad $291,200
Regional Magazine Ad $198,000
Other Media Spend:
Contingency Fund $2,525,600 Collaborations $10,500,000
Events
$232,500
People Power $1,130
Email Newsletter
$27,000
Google AdWords
$460,000
LinkedIn Promoted Posts $129,870
TikTok Challenge/Ad $600,000
Bus Wrap Interior $10,500
Public Bench $6,000
Bus Stop Takeover $144,000
12

Projected KPIs for Flights
Brand awareness: Viewers interacting with advertisements in any way exposes them to the brand. Consumers purchasing and subscribing to Meta.com will help with word of mouth and recognition. We want Meta to be the first brand in their minds for all their VR headset needs.
The click-through-rate measures how many users on the website used a specific link to get there compared to the total number. This will show us which advertisements effectively directed people to the website.
Conversions: Conversions help to track who actually follows through with their interaction with the brand and ultimately makes purchases. The higher conversion rates are, the more people the product is actually reaching.
Engagement: Rise in followers creates a wider sense of brand awareness. More comments and shares engages followers in content. Hashtag usage attracts audiences. Awareness can be gained by influencer endorsement.
Filter or lens use: This is measuring the amount of times a filter or lens is used on Snapchat, Instagram, or any other filter- supporting app. The more people that use it, the more people that become aware of the brand.
Hashtag use: Getting potential consumers involved online can be as easy as creating a catchy hashtag. If it is unique, brands are easily able to tell how many people are interacting with their hashtag, giving fast numbers.
Item sales: Measuring merchandise sales is a great way to measure how many people care about your brand and are loyal to you. Many people will see the merchandise after it has been purchased, and exposure will only grow.
Local sales: Tracking local sales helps to see if there is a large difference in sales among several smaller areas. This helps to see if different strategies, like billboard placement, are especially effective
Profit: This helps us to measure the Increase in product purchases throughout both physical retail locations and the brand’s website. This is the total overall amount of money made.
Promo code: This shows how many people made purchases using specific discounts. This will make sure that product trial increases, because consumers love discounts. If they like the product, they are even more likely to come back for more of it, and at full price.
Reach: Reach simply measures the amount of people who have seen a message. Knowing the reach of an advertisement tells you how effective it was at getting the message out.
Website Traffic: This is simply the amount of people who visit the brand’s website, for whatever reason. An increase in website traffic means an increase in both brand exposure and product sales.

13
ROI Outcomes Summary
Our projected of Return of Investment for our Meta Quest Campaign taking place September 2022 – February 2023 to gather roughly 2.4 billion impressions. Focusing on brand awareness, purchase increase, and customer retention, our sales are projected to increase at least 30% over the span of the six months.

14

MAHV Agency